Descriptive research: methods, examples, and how to apply it
Descriptive research is a research methodology that focuses on understanding the particular characteristics of a group, phenomenon, or experience.

Key Takeaways
- Descriptive research answers "what's happening," not "why" or "what if": It quantifies current patterns and behaviors before you test changes or run experiments.
- Quantitative and qualitative methods serve different goals: Surveys and secondary data give you breadth across many people; interviews and observation give you depth from fewer people.
- Let your research question pick the method: Use surveys to measure how many people feel or do something, secondary data to describe patterns already sitting in your records, and interviews or observations to understand how or why.
- Combine methods for the strongest picture: A survey identifies broad patterns, and follow-up interviews explain why those patterns exist.
Descriptive research answers a straightforward question: what's happening here? It's the foundation of understanding markets, audiences, and behaviors before you make decisions or run experiments.
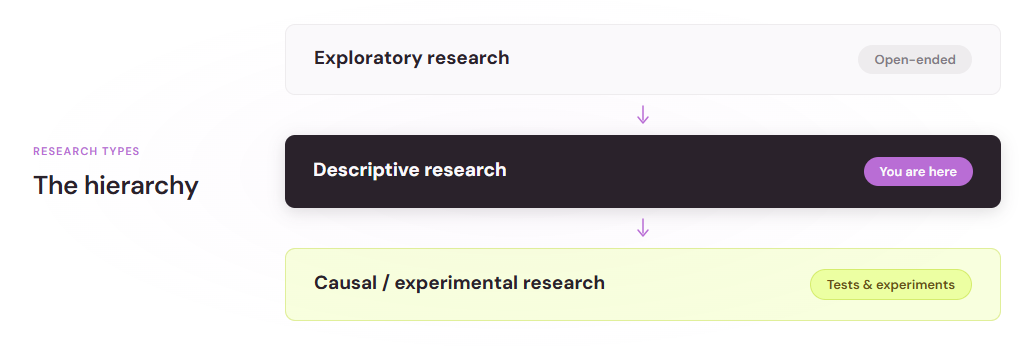
Unlike exploratory research (which asks "why?") or causal research (which tests "if this, then that?"), descriptive research paints a detailed picture of a situation as it exists. It quantifies patterns, identifies trends, and captures characteristics of groups or phenomena.
What descriptive research is
Descriptive research is a systematic approach to gathering information about the current state of something—a market, a behavior, an audience, or a product experience. It observes and records what exists, without deliberately changing variables or testing cause-and-effect relationships.
The goal is specificity. Instead of broad hunches, you collect concrete data: how many people prefer option A over option B, what percentage of users abandon a checkout flow, which demographic segments buy most frequently.
Key characteristics
Descriptive research has a few defining traits:
- Observational, not interventional – You measure the current state without manipulating variables
- Concrete and specific – Results are detailed snapshots: "42% of respondents prefer Feature A"
- Quantifiable (often) – Many descriptive studies produce statistics, though qualitative descriptions also count
- Cross-sectional – Most descriptive research captures a moment in time or a defined period
Descriptive research methods: Overview and comparison
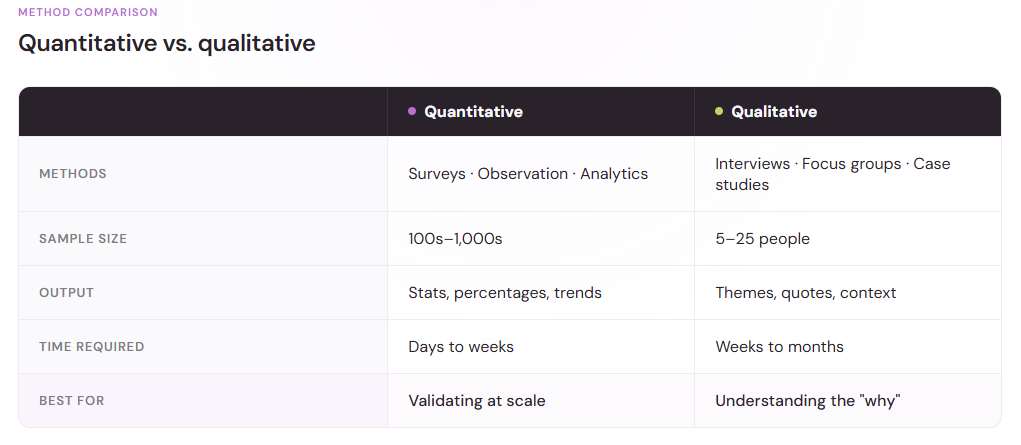
Descriptive research encompasses several methods, each suited to different questions and contexts. The main approaches fall into two camps: quantitative (counting and measuring) and qualitative (exploring and understanding in depth).
Quantitative descriptive methods
Surveys and questionnaires are the foundation of descriptive research. Online surveys rank as the most used quantitative method, with 85% of market research professionals using them regularly. They're fast, scalable, and produce numbers you can analyze statistically.
Structured observations record behaviors in their natural setting. A retail researcher might time how long customers spend in each aisle. A UX researcher might watch users navigate a website, noting where they pause or abandon a task.
Secondary data analysis takes existing data—sales records, website analytics, customer databases—and describes patterns within it. It's fast and cost-effective, though limited to what's already been recorded.
Qualitative descriptive methods
User interviews and focus groups let you explore what people think, feel, and experience. User interviews rank among the most popular UX research methods. They produce rich detail—direct quotes, examples, observed reactions—that surveys alone can't capture.
Case studies describe a specific situation, organization, or individual in depth. A case study might document how a company redesigned its onboarding process and what resulted.
Quantitative methods give you breadth—data from many people—and produce comparable numbers. Qualitative methods give you depth—rich detail from fewer people—and produce themes and context.
How to choose the right descriptive research method
Your choice depends on your research question, audience, timeline, and resources.
Start with your research question
Be specific:
- "What percentage of our customers are satisfied with our support?" → Survey
- "How do new users experience our onboarding flow?" → Interviews or usability testing
- "Which features do our most valuable customers use most?" → Secondary data analysis
- "What frustrates customers about our pricing page?" → Interviews or observation
Consider your audience and access
Surveys work best when you have contact information and respondents can spare 5–15 minutes. Interviews require recruiting people willing to spend 30–60 minutes. Observation requires direct access to your environment.
Factor in timeline and budget
Surveys are fast. Launch today and get responses within days. Interviews take weeks to recruit and conduct. Online surveys cost far less than in-person interviews.
Think about rigor and detail
If you need statistical confidence, surveys provide the weight you need. If you need to understand how customers use something or why they decide, interviews capture details that surveys miss.
Common descriptive research examples
Market research and sizing
A company surveys 500 small-business owners and reveals that 60% use competitor products, 30% use multiple tools, and 10% manage manually. Follow-up interviews with 12 respondents describe their workflow and which features they'd switch for.
Customer satisfaction and feedback
A satisfaction survey produces a benchmark: 72% of respondents are satisfied. Open-ended responses and interviews explain what drives that satisfaction.
Usability testing and UX research
Showing a prototype to real users and observing their behavior is descriptive research. You watch them attempt tasks and record comments. You're describing what happens: "Users found the checkout button, but 8 out of 10 users said the label was unclear."
Usability testing ranks among the most popular UX research methods.
Product feature adoption and usage
Analyzing which features your users adopt and how often is descriptive research. You describe the current state: "30% of users enable notifications, and they return 2.5 times more often than users who don't."
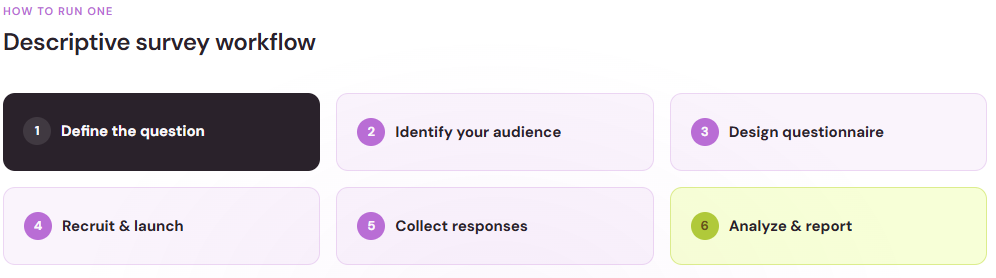
Best practices for conducting descriptive research
Design clear questions
Avoid ambiguous wording. "How satisfied are you?" is vague. "On a scale of 1 to 10, how satisfied are you with the speed of our checkout process?" is clear.
Neutral wording reduces bias. Social desirability bias causes people to overreport good behavior or underreport sensitive issues.
Choose your sample size strategically
For surveys, larger samples reduce margin of error. A margin of error of three to six percent at a 95% confidence level is typical for business research.
For interviews, saturation often happens around 15–23 interviews.
Combine methods when you can
Surveys give breadth; interviews give depth. A survey of 200 customers identifies broad patterns. Follow-up interviews with 10–15 respondents explain why those patterns exist. Every $1 invested in UX research returns $100 in value.
Validate before launch
Test your survey with a colleague. Does the language make sense? Do response options cover real answers? For interviews, do a practice run with someone outside your team.
Analyze carefully
Quantitative data needs statistical analysis: percentages, averages, and demographic breakdowns. Qualitative data needs thematic analysis: identifying common themes and quoting representative examples.
Descriptive research as a foundation
Descriptive research answers the foundational question: what's the current state? It's where nearly all research programs start. You describe markets, customers, and behaviors before you experiment with changes or test hypotheses.
When you need to decide whether to launch a feature, enter a market, or fix a process, descriptive research gives you grounded facts. Surveys, interviews, observations, and data analysis all serve the same purpose: turning assumptions into understanding.
Start with a clear question, choose the method that fits your constraints, and let the data guide your next steps.